
Your Dashboard Shows What Changed. Now Ask Why.
Turn a business question into a useful analysis with plain English exploration, visible evidence and context your team can review.
“Revenue is up. Why is gross margin down?”
Your dashboard has surfaced a useful signal. Now the investigation becomes more specific: did the business sell a different mix of products, reduce prices, or face higher costs?
That question may lead to several more. You need to compare periods, examine individual products and decide whether the pattern warrants action.
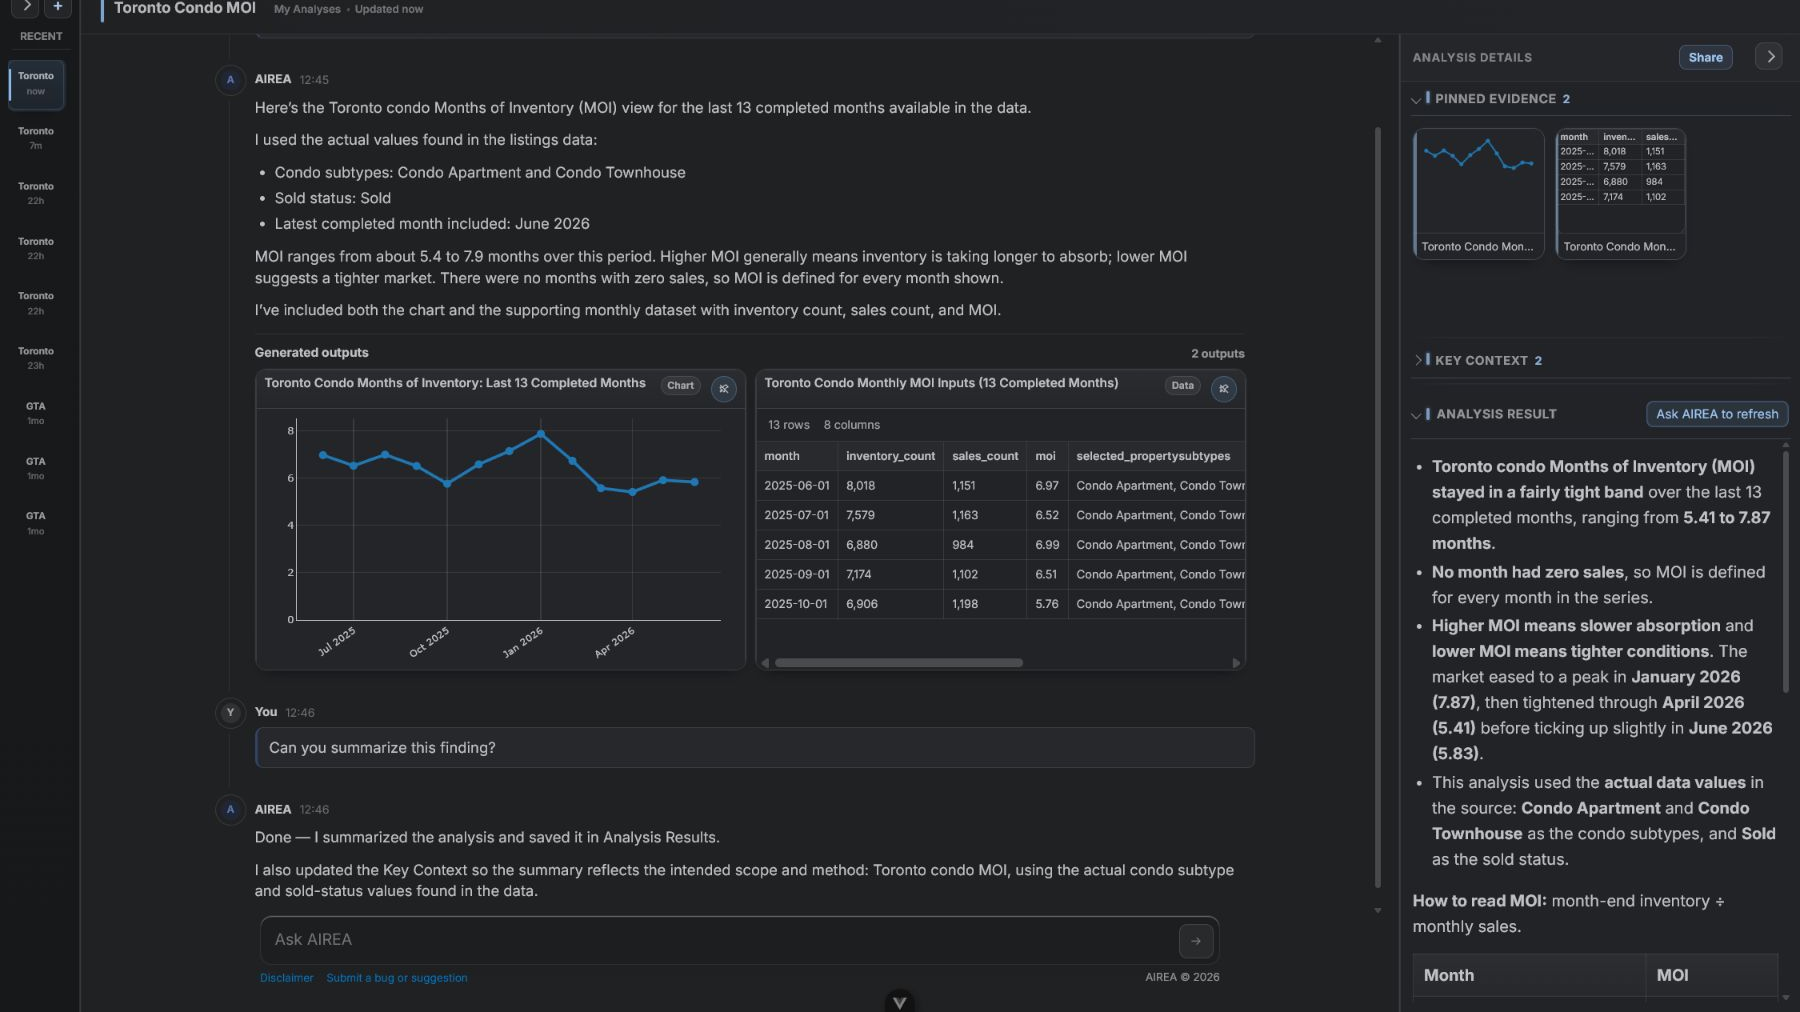
Conversational analytics lets people explore and understand business data by asking questions in natural language. In AIREA, that means asking questions of your company data in plain English, reviewing charts and tables, and developing an analysis with evidence and context attached. The aim is to help people investigate an operating question and understand what supports the answer.
Start with the decision behind the question
A useful analysis begins with a clear purpose. “Tell me about sales” leaves a great deal open. “Which products contributed most to the decline in gross margin last month?” gives the investigation a direction.
Be specific about the period, measure and comparison. In this example, gross profit means revenue less the cost of goods sold, and gross margin means gross profit as a percentage of revenue. Agree which costs are included before interpreting the results.
Dashboards remain useful for monitoring agreed measures. Conversational analytics helps with the questions that arise when somebody needs to understand the detail behind them. Your business knowledge gives those questions purpose; the available data determines what can be supported.
Explore: follow the question into the detail
Consider a hypothetical distributor reviewing its monthly results, with product, period, units sold, revenue and product cost available for the analysis.
The finance manager starts with:
Compare revenue, gross profit and gross margin percentage by product for the last two completed months. Identify the products contributing most to the decline in overall gross margin, considering both changes in each product’s margin and its share of revenue.
AIREA can generate outputs such as tables, charts and summaries during an analysis. Those outputs give the manager something to inspect and a basis for the next question:
For those products, compare selling price per unit, cost per unit and units sold.
The manager can then explore whether the pattern is concentrated in a few products or spread more broadly. Each question narrows the investigation. A change in the numbers can suggest an explanation, but establishing a cause may require business context or information that is not in the dataset.
Analyze: check what supports the conclusion
Before taking the analysis into a meeting, review the work behind it. Does the comparison use the intended periods? Are the measures calculated consistently? Do the totals agree with the source the team uses?
In AIREA, users can open a generated output and inspect its Lineage View to review how it was created through process steps described in plain English. This makes the analytical work more visible. It still requires the reviewer to consider whether the data, assumptions and interpretation fit the business question.
Pin the charts, tables or summaries that support the conclusion as evidence. Add relevant Key Context before generating the analysis result. For the distributor, that context might explain a known promotion or a change in the product range. Keep an observed pattern separate from an explanation that still needs confirmation.
A useful result states what changed, identifies the supporting evidence and makes the unresolved questions clear. “The decline is concentrated in these products; we need to confirm whether the promotion explains the price change” gives the team a concrete next step.
Share: keep evidence and context with the result
A screenshot can show a number while leaving the recipient to reconstruct how it was reached. Sharing a useful analysis should carry enough context for another person to review the conclusion.
AIREA supports sharing the current analysis result with its pinned evidence and Key Context attached. If that evidence or context changes, the result needs to be generated again before sharing. This keeps the shared result aligned with the material selected to support it.
For the distributor, the shared analysis can frame a focused conversation about the products to investigate and the assumptions to confirm. The team remains responsible for deciding what to do.
Choose one question worth investigating
For a first analysis, choose a question that matters to an upcoming decision and that the available data can reasonably support. Make it specific enough to check, and involve someone who understands the business context.
Write down the question, the required data, the measure definitions and what you would need to see before accepting a conclusion. Then explore the detail, inspect the supporting work and share the result with its evidence attached.
Bring that question to an AIREA pilot conversation. It is a practical starting point for seeing how Explore, Analyze, Share could fit the way your team works.
Bring your next business question.
Explore how AIREA could fit the way your team works.
Join the pilot